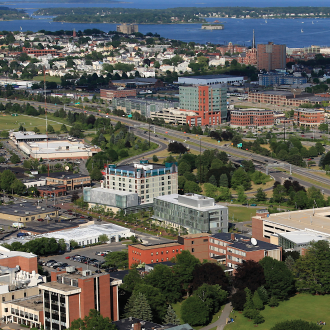

Geography-Anthropology
Geography-Anthropology integrates the two disciplines to examine the relationship between human populations and their natural and built environments.
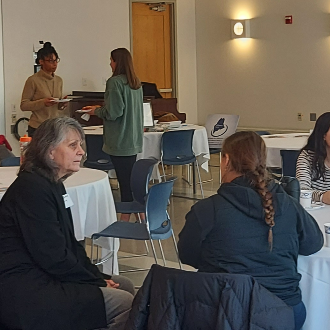
Policy, Planning, and Management
Graduate-level education and training for careers in the public and nonprofit sectors. Out-of-state students now receive a reduced tuition rate.
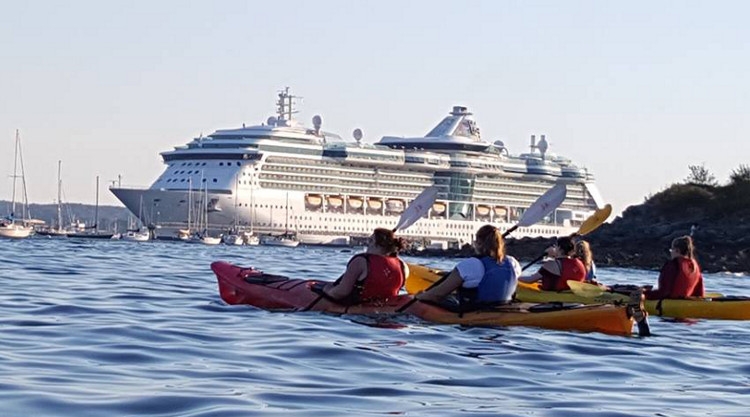
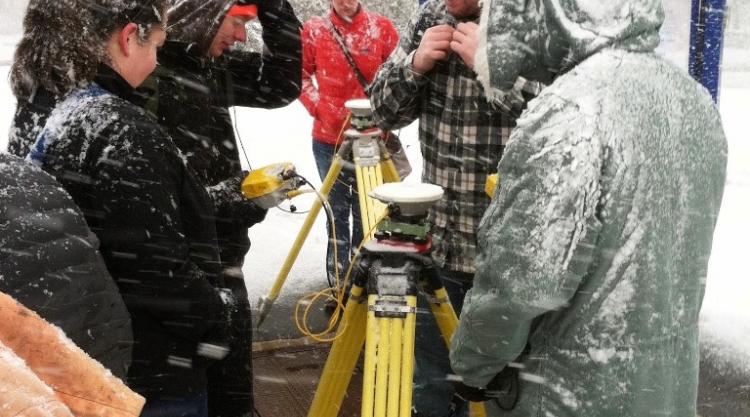
Tourism and Hospitality
The Tourism and Hospitality program is the first of its kind in Maine- a truly interdisciplinary experience that looks at all aspects of Maine’s keystone industry.

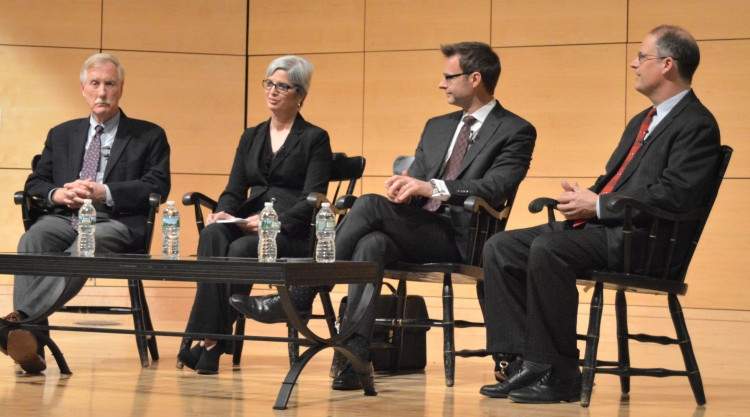
Public Health
Bridging public health and health care delivery systems to build a more effective, sustainable infrastructure. Out-of-state students receive a reduced tuition rate.

Muskie Legacy & Board of Visitors